
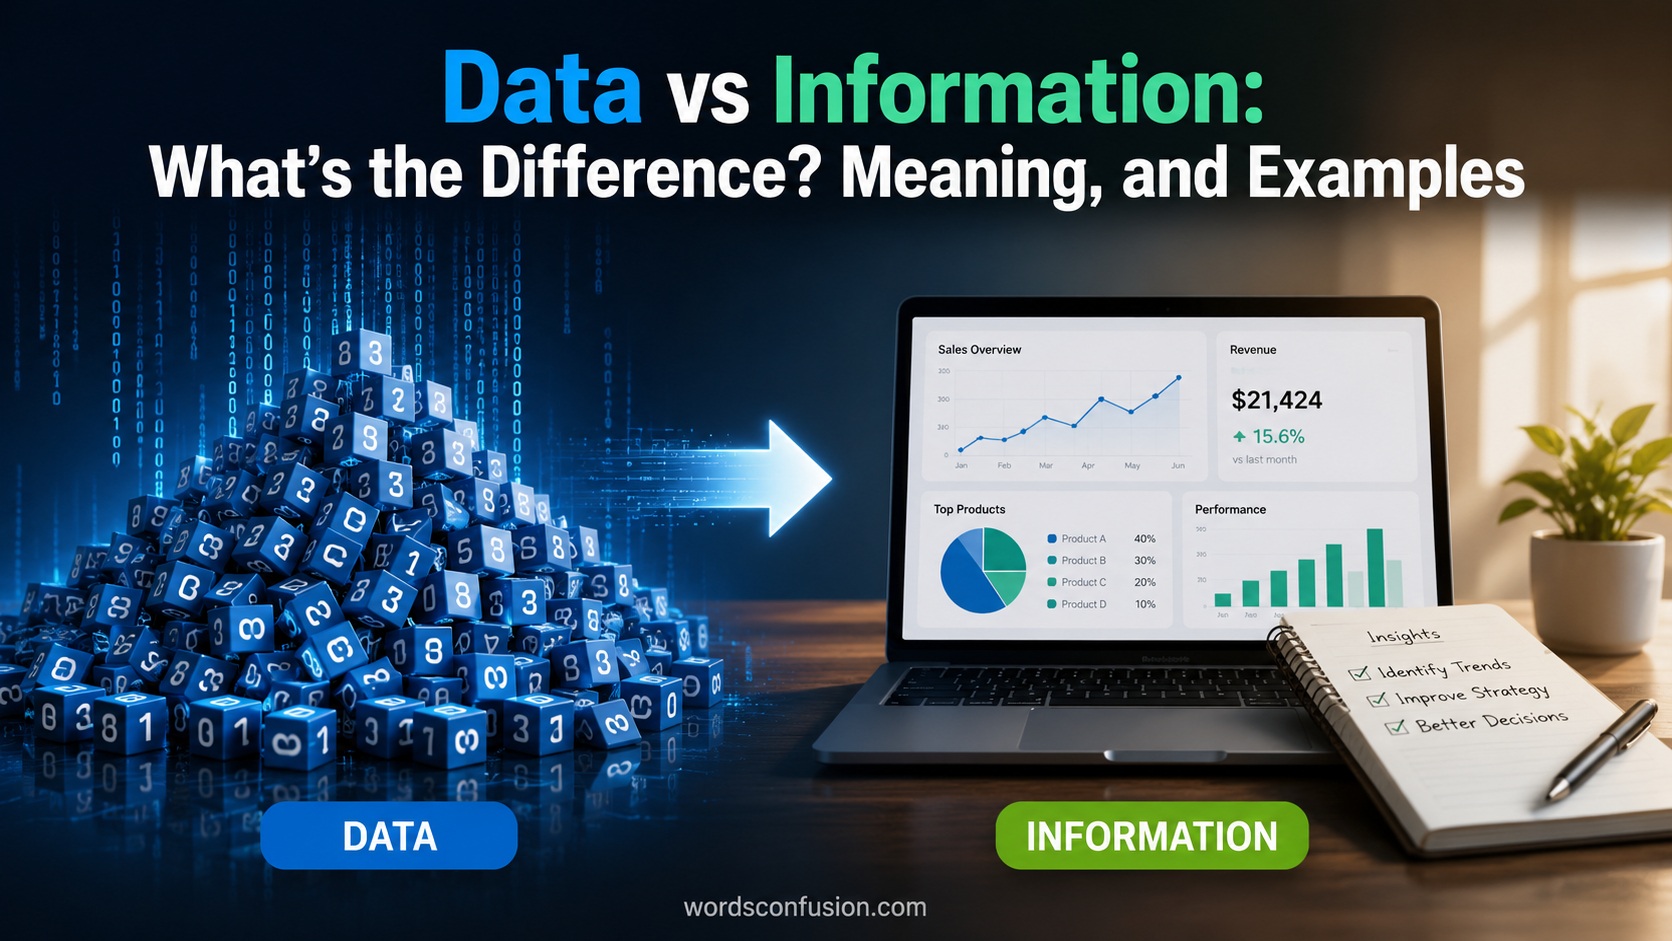
Data vs information are two terms people often use as if they mean the same thing. You hear them in business meetings, classrooms, technology discussions, and everyday conversations. Yet they represent different stages of the same process. Understanding that difference can help you make smarter decisions, interpret reports correctly, and communicate more effectively.
Think about a grocery receipt. It lists dozens of numbers, product names, and prices. At first glance, those are just pieces of data. However, when you calculate your total spending, identify your most expensive purchases, or compare this month’s expenses with last month’s, those raw facts become meaningful information. The context changes everything.
Whether you’re a student writing a research paper, a business owner reviewing sales reports, or a data analyst building dashboards, knowing how data transforms into information gives you a clear advantage. It helps you separate facts from insights and avoid making decisions based on incomplete evidence.
This guide explains the difference between data vs information in simple language. You’ll learn their definitions, characteristics, examples, real-world applications, and why the distinction matters in education, business, healthcare, technology, and everyday life.
Quick Answer
Data consists of raw facts, figures, observations, or measurements that have not been processed or interpreted. On their own, data points often lack meaning because they have little or no context.
Information is data that has been processed, organized, analyzed, and presented in a meaningful way. It answers questions, reveals patterns, and supports better decision-making.
For example:
- Data: 72, 68, 91, 85, 79
- Information: These are the exam scores of five students. The class average is 79%, and one student scored above 90%.
The numbers alone are data. Once you explain what they represent and analyze them, they become information.
Data vs Information: Quick Comparison
| Feature | Data | Information |
| Definition | Raw facts and figures | Processed and meaningful data |
| Context | Usually lacks context | Includes context and meaning |
| Processing | Unprocessed | Organized and analyzed |
| Purpose | Collection and storage | Understanding and decision-making |
| Form | Numbers, text, images, symbols, measurements | Reports, charts, summaries, dashboards |
| Value | Limited without interpretation | High because it provides insights |
| Decision-Making | Rarely useful by itself | Helps people make informed decisions |
| Example | 250, 320, 280 | Monthly sales increased by 15% compared to last month |
What Is Data?
Definition of Data
Data refers to raw facts, observations, measurements, or values collected from various sources. These facts may exist as numbers, words, images, audio recordings, videos, or symbols. By themselves, they rarely tell a complete story because they lack interpretation.
Data acts as the foundation of every analysis. Every report, graph, prediction, and business strategy begins with collecting data.
For example, imagine a weather station records the following temperatures throughout the day:
- 68°F
- 71°F
- 74°F
- 77°F
- 75°F
These readings are simply measurements. Without knowing when they were recorded or what they represent, they remain raw data.
Key Characteristics of Data
Data has several defining characteristics.
- Raw and unprocessed
- Collected from observations or measurements
- May be qualitative or quantitative
- Can exist in digital or physical form
- May not provide meaning without context
- Serves as the input for analysis
- Can be structured or unstructured
Because data is unprocessed, different people may interpret it differently until someone organizes and analyzes it.
Types of Data
Understanding the different types of data helps explain why organizations collect it in many forms.
Quantitative Data
Quantitative data consists of numerical values that you can measure or count.
Examples include:
- Sales revenue
- Age
- Temperature
- Population
- Distance
- Website visitors
Example:
| Product | Units Sold |
| Laptop | 150 |
| Tablet | 90 |
| Phone | 310 |
Qualitative Data
Qualitative data describes qualities, characteristics, opinions, or experiences instead of numbers.
Examples include:
- Customer reviews
- Interview responses
- Product feedback
- Survey comments
- Employee opinions
Example:
“The customer found the checkout process quick and easy.”
Structured Data
Structured data follows a predefined format, making it easy to search and analyze.
Examples include:
- Excel spreadsheets
- SQL databases
- Payroll records
- Customer lists
Unstructured Data
Unstructured data has no fixed format.
Examples include:
- Emails
- Videos
- Images
- Social media posts
- Audio recordings
- PDF documents
Experts estimate that most newly created digital data is unstructured, which makes organization and analysis more challenging.
Semi-Structured Data
Semi-structured data falls somewhere between structured and unstructured data.
Examples include:
- JSON files
- XML documents
- Email metadata
- Log files
Although it doesn’t follow a traditional database format, it still contains tags or labels that help organize its content.
Read More: Accuracy vs Precision: What’s the Difference? Meaning, Examples, and Correct Usage
Simple Examples of Data
Here are a few everyday examples.
| Situation | Raw Data |
| Classroom | 85, 91, 78, 88 |
| Hospital | Blood pressure readings |
| Bank | Daily transactions |
| Sports | Player statistics |
| Website | Number of visitors |
| Store | Product prices |
Notice that each example contains facts without explaining what they mean.
What Is Information?
Definition of Information
Information is data that has been processed, organized, interpreted, or analyzed to provide meaning.
Information answers questions such as:
- What happened?
- Why did it happen?
- What does it mean?
- What should happen next?
Instead of presenting isolated facts, information connects those facts into a meaningful picture.
Imagine an online store records 12,500 website visitors in one month. That figure alone is data.
Now consider this statement:
Website traffic increased by 22% after launching a new advertising campaign, leading to a 15% increase in online sales.
That statement provides context, relationships, and insights. It is information.
Key Characteristics of Information
Useful information usually has several important qualities.
- Meaningful
- Organized
- Relevant
- Accurate
- Timely
- Reliable
- Easy to understand
- Actionable
Organizations depend on high-quality information because poor information often leads to poor decisions.
Examples of Information
Here are several practical examples.
| Data | Information |
| 450 customers visited today | Customer traffic increased by 18% compared to yesterday. |
| 93, 88, 95, 90 | The class average was 91.5%, indicating excellent overall performance. |
| 8.2%, 7.9%, 7.4% | The inflation rate has steadily declined over the last three months. |
| 2,500 support tickets | Support requests dropped after the new software update. |
Each example explains what the data means rather than simply presenting raw numbers.
Why Information Is More Valuable Than Data
Data has potential value, but information delivers actual value.
Imagine someone hands you a spreadsheet containing one million rows of numbers.
Could you immediately answer these questions?
- Which products perform best?
- Which customers spend the most?
- Which region generates the highest revenue?
- Which month experienced the fastest growth?
Probably not.
Now imagine the same spreadsheet transformed into colorful charts, summaries, and trend reports.
Within minutes, you could identify opportunities, solve problems, and make confident decisions.
That’s the power of information.
The Main Difference Between Data and Information
Although data and information work together, they serve different purposes.
Data acts as the raw material, while information becomes the finished product.
A simple analogy makes this easier to understand.
Imagine you’re baking a cake.
- Flour is data.
- Sugar is data.
- Eggs are data.
- Butter is data.
- Chocolate is data.
Individually, these ingredients don’t satisfy anyone.
Once you mix, bake, and decorate them, they become a delicious cake.
The finished cake is information.
Processing transforms scattered ingredients into something useful, just as analyzing data transforms facts into meaningful information.
Side-by-Side Comparison
| Aspect | Data | Information |
| Nature | Raw facts | Processed facts |
| Meaning | Usually lacks meaning | Clearly communicates meaning |
| Context | Minimal or none | Rich context |
| Role | Input | Output |
| Processing | Not analyzed | Analyzed and interpreted |
| Decision Support | Limited | Essential |
| Organization | Random or collected | Structured and summarized |
| Users | Researchers, sensors, software | Managers, students, customers, decision-makers |
Data vs Information: A Practical Example
Imagine a retail store records the following sales for one week.
| Day | Sales |
| Monday | $4,500 |
| Tuesday | $5,000 |
| Wednesday | $4,800 |
| Thursday | $6,300 |
| Friday | $7,100 |
These numbers are data.
After analyzing them, the store manager writes this report:
- Friday generated the highest sales.
- Sales increased steadily during the week.
- Weekend promotions likely boosted customer purchases.
- Average daily sales reached $5,540.
That report is information because it explains the significance of the numbers rather than simply listing them.
FAQs:
What is the simplest difference between data and information?
The simplest way to understand the difference is this: data is raw facts, while information is meaningful data. Data may consist of numbers, words, or measurements without context. Information organizes and explains that data so people can understand it and make informed decisions.
Can information become data again?
Yes. Information can become data when someone uses it as an input for another analysis. For example, a company’s annual sales report is information. If researchers combine that report with reports from hundreds of other companies for market research, each report becomes part of a larger dataset.
Why is context important in information?
Context gives data meaning. Without context, numbers or facts may be confusing or even misleading. For example, the number 95 means very little by itself. If you know it represents a student’s exam score, yesterday’s temperature, or a customer’s satisfaction rating, it becomes meaningful information.
Is all data useful?
No. Some data may be outdated, incomplete, inaccurate, or irrelevant. Organizations often collect far more data than they actually need. They must clean, organize, and analyze it before determining which data provides valuable information.
What is the difference between data, information, and knowledge?
These three concepts build on one another.
- Data consists of raw facts and observations.
- Information is processed data that provides meaning and context.
- Knowledge is the understanding gained from information through experience, learning, and analysis. It enables people to make sound judgments and informed decisions.
Conclusion:
Although people often use data and information interchangeably, they serve different purposes. Data represents raw facts, figures, observations, or measurements. On its own, it offers limited value because it lacks context. Information, on the other hand, transforms that raw data into meaningful insights through organization, analysis, and interpretation.
The distinction matters in every field. Businesses rely on information to improve profits, healthcare professionals use it to diagnose patients, educators analyze it to track student progress, and governments depend on it to shape public policy. In each case, high-quality decisions begin with accurate data and end with reliable information.

Andrew Wilson is an experienced language researcher and content writer specializing in WordsConfusion topics. He helps readers understand commonly confused English words, spelling differences, grammar rules, word meanings, and proper usage through clear explanations, practical examples, and easy-to-follow language guides. His goal is to make English learning simple, accurate, and accessible for students, writers, professionals, and everyday learners.